a) Find the daily percentage change for each index.
b) Graph the the percent changes of the three indices in the system of axes.
c) From the graphs, which of the three indices changed most during the month of January 2022?
c) Calculate the standard deviation of the percent change of each index and verify your answer to part c).
Solution to Example 1
a)
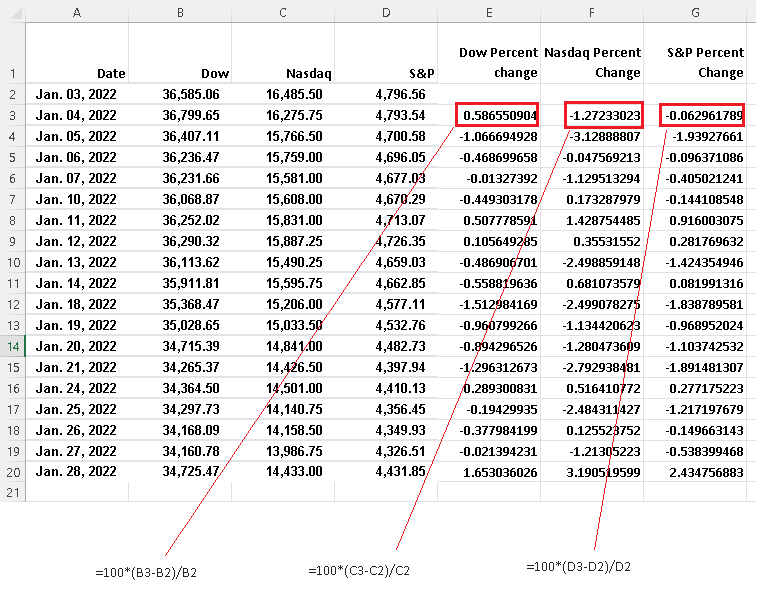
Excel is used for the calculation of percentage change for each index.
The daily percentage change from day \( d - 1\) to day \( d \) is calculated using the formula
\[ 100 \times \dfrac{ \text{Index Value of day} \; \; d - \text{Index Value of day} \;\;(d - 1)}{ \text{Index Value of day} \;\; (d - 1)} \]
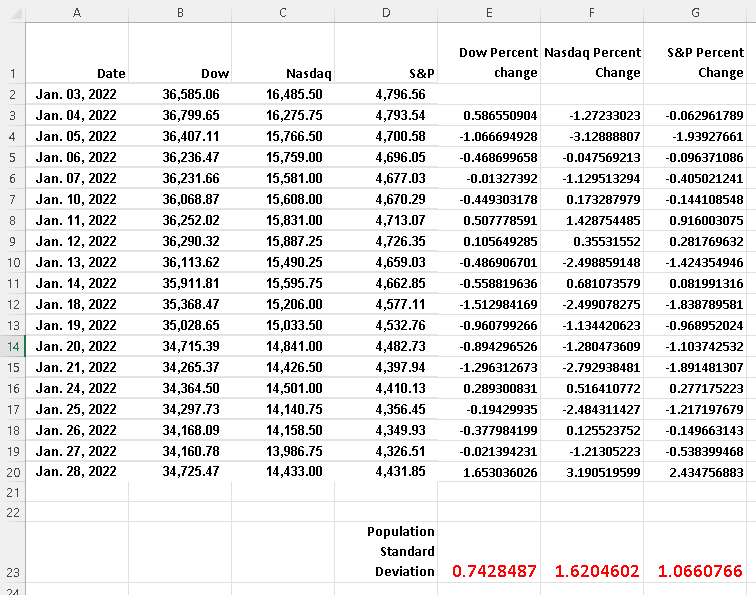
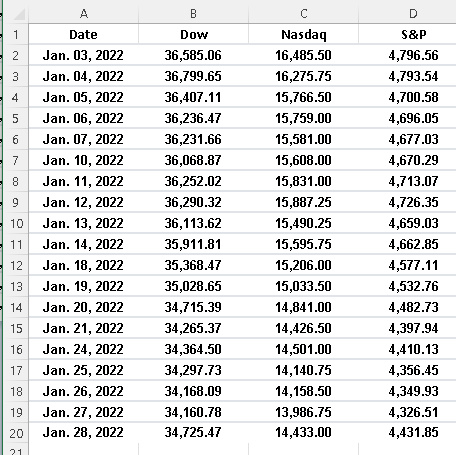
In the examples below, the values of the indices are in columns B,C and D and the calculated percentage change will be in columns E, F a,d G.
The Dow starts in cell B2, type the formula "=100*(B3-B2)/B2" in E3, and then copy the formula in the cell E3 in the cells E4, E5, ....
The Nasdaq starts in C2, type the formula "=100*(C3-C2)/C2" in cell F3, and then copy the formula in the cell F3 in the cells F4, F5, ....
The S&imp;P starts in D2, type the formula "=100*(D3-D2)/D2" in G3, and then copy the formula in the cell G3 in the cells G4, G5, ....
The results are shown below.
b)
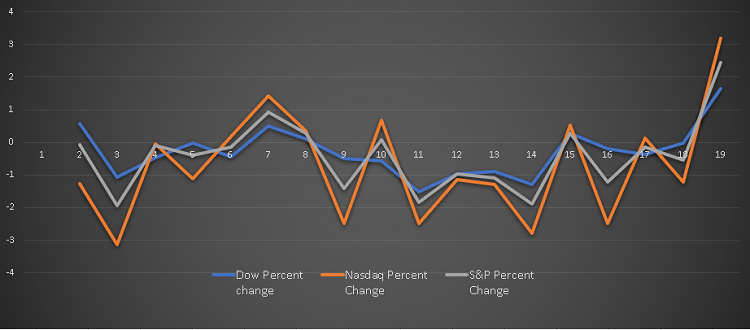
The graphs of the percentage changes of all three indices is shown below.
c)
From the graphs above, the Nasdaq has changed most during the month of January 2022.
d)
One way to measure the changes in a given data set is to calculate and compare the standard deviation of the percentage change of all three indices.
Below is shown the way to calculate the standard deviation using Excel.
Use the function "=STDEV.P(E3:E20)" in a cell below the data of the percentage change of Dow index which is in column E and then press "Enter".
Use the function "=STDEV.P(F3:F20)" in a cell below the data of the percentage change of Nasdaq index which is in column F and then press "Enter".
Use the function "=STDEV.P(G3:G20)" in a cell below the data of the percentage change of S&imp;P index which is in column G and then press "Enter".
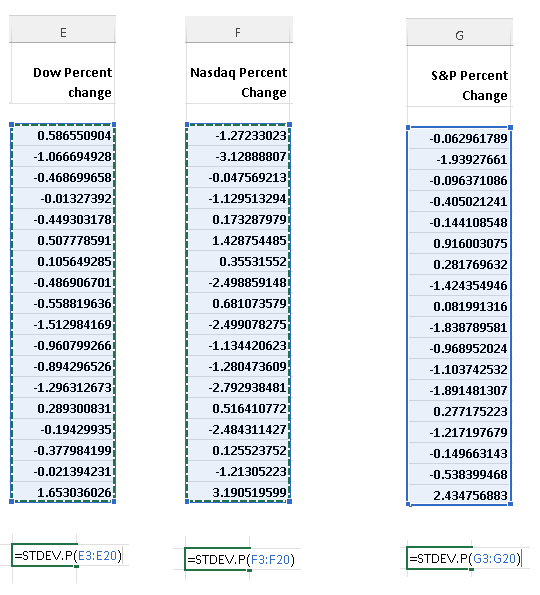
The results of the standard deviation of all three indices is shown below and we can confirm that the Nasdaq standard deviation is the largest as explained in part c)