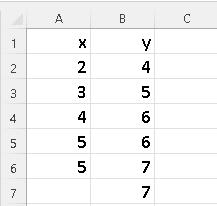
Step 1 - Organize the data sets in columns and use labels X and Y, for example, in the first row as shown below.
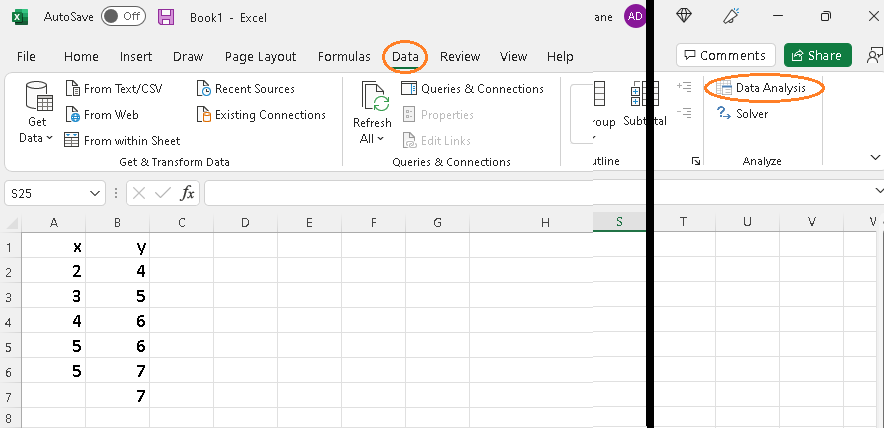
Step 2 - Press on the "Data" tab and click on "Data Analysis".
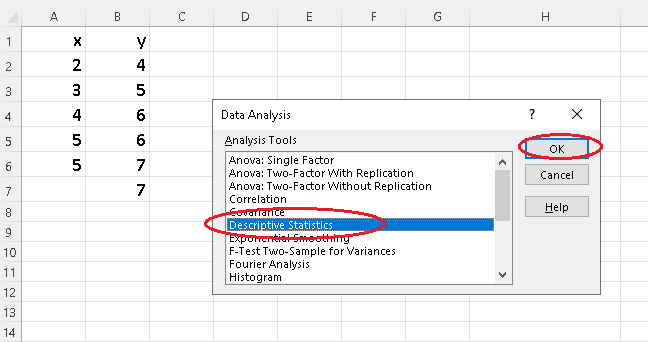
Step 3 - Select "Descriptive Statistics" and press "OK".
Step 4 - Clear "Input Range" and "Output Range".
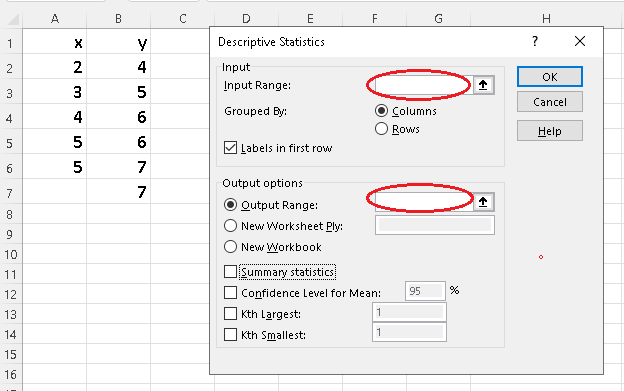
Step 5 - Click inside "Input Range" and use the mousse to select the columns containing the data of all the samples, in this case samples X and Y including the labels X and Y.
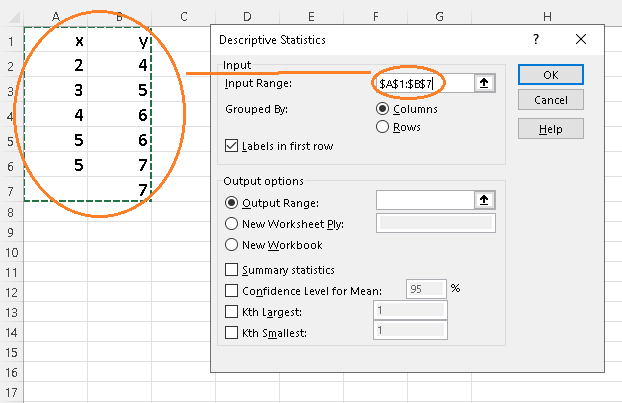
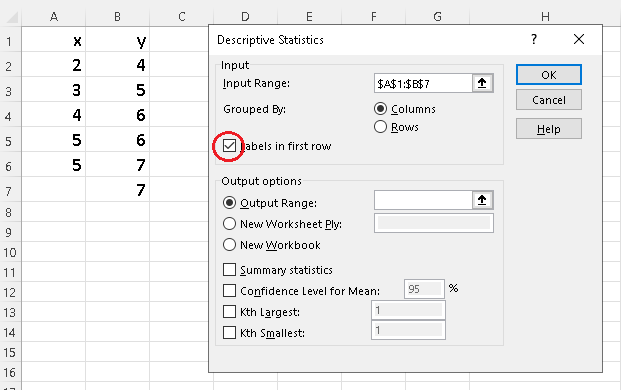
Step 6 - Check "Labels" because you selected the labels X and Y in the last step. The labels make it easy to read your final results.
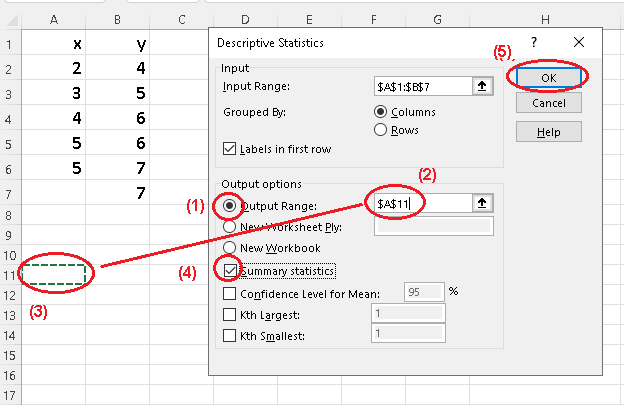
Step 7 - Follow the substeps (1) to (5) as follows:
(1) check "Output Range"
(2) click inside the small window
(3) click to select a cell
(4) check "Summary Statistics"
(5) click "OK".
Step 8 - Read and interpret results from table.
Several different statistics such as the mean, median, mode, standard deviation, ... are displayed on a table for both X and Y samples.
