Measures of Central Tendency
Table of Contents
The three measures of central tendency which are the mean , median and mode and their properties are presented with examples and their solutions. Problems and their solutions are also included.
The Mean
The mean of data values in a sample is the sum of all data values divided by the number of data values in the set [1] [2] [3] [4].
Let \( \{ x_1, x_2, ..., x_n \} \) be data values of a sample.
The mean \( \bar x \) of the sample is given by
\[ \bar x = \dfrac{\sum_{i=1}^n x_i}{n} \]
Let \( x_1, x_2, ..., x_N \} \) be the data values of a population.
The mean \( \mu \) of the population is given by
\[ \mu= \dfrac{\sum_{i=1}^N x_i}{N} \]
Note the difference in the notation of the sample mean \( \bar x \) and the population mean \( \mu \).
Example 1
Given the data values in the samples \(S_1\) and \(S_2\) below; for each sample find the mean and check that \( \sum_{i=1}^n (x_i- \bar x) = 0 \).
\(S_1\): \( -3 , 7 , 7 , 8 , 13 , 4 , 6 \)
\(S_2\): \( -3 , 7 , 7 , 8 , 13 , 4 , 160 \)
Solution to Example 1
Sample \(S_1\), mean: \( \bar x_1 = \dfrac{-3 +7+ 7 + 8 + 13 + 4 + 6}{7} = 6\)
Sample \(S_1\): \( \sum_{i=1}^n (x_i - \bar x_1) = (-3 - 6) +(7 - 6)+ (7-6) + (8-6) + (13 - 6) + (4 - 6) + (6 - 6 ) = 0 \)
Sample \(S_2\), mean: \( \bar x_2 = \dfrac{-3 + 7 + 7 + 8 + 13 + 4 + 160}{7} = 28\)
Sample \(S_2\): \( \sum_{i=1}^n (x_i - \bar x_2) = (-3 - 28) +(7 - 28)+ (7-28) + (8-28) + (13 - 28) + (4 - 28) + (160 - 28 ) = 0 \)
Note that
1 - Samples \(S_1\) and \(S_2\) differ by one data value only: the \( 6 \) in \(S_1\) and \( 160 \) in \(S_2\). This difference gives a large difference between the two means. this due to the fact that \( 160 \) is much larger than the other data values in the sample \( S_2 \). In such case \( 160 \) is called an outlier .
2 - The property of the mean \( \sum_{i=1}^n (x_i- \bar x) = 0 \) has been shown for these examples but is true for any sample.
3 - The mean is always included between the minimum value and the maximum value of the data sample.
The Median
The median is a data value in the center of the in ordered data set. One half of the data lie above the median and the other half lie above the median [1] [2] [3] [4].
Example 2
Given the data in the samples \(S_1\) and \(S_2\) below, for each sample find the median.
\(S_1\): \( -3 , 7 , 7 , 8 , 13 , 4 , 6 \)
\(S_2\): \( -3 , 7 , 7 , 8 , 13 , 4 , 160 \)
Solution to Example 2
Step 1: Order the data in each sample
\(S_1\): \( -3 , 4 , 6 , 7 , 7 , 8 , 13 \)
\(S_2\): \( -3 , 4 , 7 , 7 , 8 , 13 , 160 \)
Step 2: Find the data value in the center of the ordered data in the sample
\(S_1\): \( -3 , 4 , 6 , \color{red}{ 7 } , 7 , 8 , 13 \)
Because the number of data vales is odd, there is value in the center of the data set which the median of the sample \( S_1 \) and is equal to 7
\(S_1\): \( -3 , 4 , 7 , \color{red}{ 7} , 7 , 8 , 160 \)
The number of data vales is odd hence the median of the sample \( S_2 \) is equal to 7, data value in the center.
Note that the sets have very different means as seen above in example 1 but they have the same median. The extreme values called outliers, such as \( 160 \) in set \( S_2 \) affect the mean but not necessarily the median.
Example 3
Given the data in the sample \(S_3\), find the median.
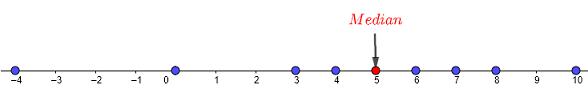
\(S_3\): \( 3 , 7 , 0 , 8 , - 4 , 4 , 6 , 10\)
Solution to Example 3
Step 1: Order the data
\( -4 , 0 , 3 , \color{red}{ 4 , 6 }, 7 , 8 , 10 \)
Because the number of data vales is even, there is no single value in the center. The median is now calculated as the average of the two values in the center.
Median of \(S_3\) = \( \dfrac{4 + 6}{2} = 5 \)
The graph below shows the data values and the median and we can see that four data values are less than the median and the other four data values larger than the median.
The Mode
The mode of a set of data is the data value that occurs with the highest frequency [1] [2] [3] [4].
Example 4
Given the data in the sample \(S_4\) and \( S_5 \), find the median.
\(S_4\): \( 3 , 7 , 0 , 8 , - 4 , 4 , 6 , 10\)
\(S_5\): \( -9 , 7 , 0 , 8 , - 4 , 4 , 6 , 8\)
Solution to Example 3
The sample \( S_4 \) has no mode since each of the data values has a frequency of occurrence equal to 1.
The data value 8 in the sample \(S_5\) has a frequency of accurence equal to 2 while each of all other data values has a frequency of occurrence equal to 1 and therefore the mode of \(S_5\) is the data value 8.
Use Mean and Median to Describe Data
Example 5
Find the mean and the median of the data below. Which is more appropriate to describe the given data, the mean or the median ? Justify the answer using a number line.
\( 12 , 0 , 43 , 18 , 23 , 35 , 51 , 11 , 299 , 9 \)
Solution to Example 5
Mean = \( \dfrac{12 + 0 + 43 + 18 + 23 + 35 + 51 + 11 + 299 + 9}{10} = 50.1\)
Order the data:
\( 0 , 9 , 11 , 12 , \color{red}{18 , 23} , 35 , 43 , 51 , 299 \)
The number of data values is even and therefore there are two data values in the middle. Hence the
Median = \( \dfrac{18 + 23}{2} = 20.5 \)
The figure below represents a number line including all data values, the mean and the median for comparison.
When we compare the mean which is \( 50.1 \) to the data values, we notice that it is higher than all of them except the extreme value 299.
The median is closer to most of the data values.
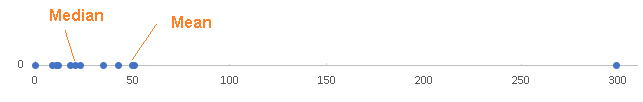
If we need to represent this data appropriately, we would use the median because it is closer to most of the data values.
Calculate the Measures of Central Tendency Using Excel
We present two methods to calculate the mean, median and mode.
Method 1: Using the functions: " =AVERAGE(A3:A19) " , " =MEDIAN(A3:A19) " and " =MODE(A3:A19) " in excel.
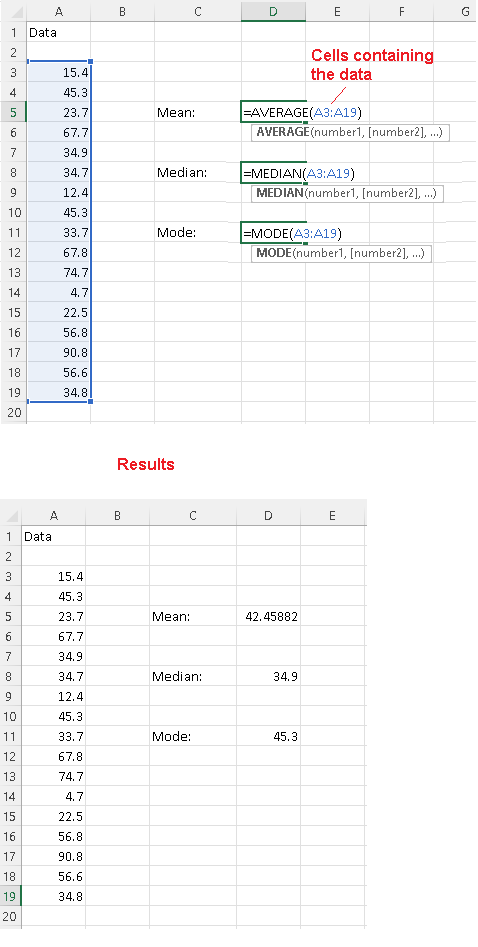
Step 1: organize the data in a column, in this example the data is included in the cells A3 to A19
Step 2: Type labels for the mean, median and mode; in this example the labels are in cells: C5, C8 and C11
Step 3 - Calculate the mean: Select a cell, D5 in this example, and type what is between the quotation marks " =AVERAGE(A3:A19) " than press "enter" in the keyboard; you should get the mean of 42.45882 if you are using the same data as in this example.
Step 4 - Calculate the median: Select a cell, D8 in this example, and type what is between the quotation marks " =MEDIAN(A3:A19) " than press "enter" in the keyboard; you should get the median of 34.9 if you are using the same data as in this example.
Step 5 - Calculate the mode: Select a cell, D11 in this example, and type what is between the quotation marks " =MODE(A3:A19) " than press "enter" in the keyboard; you should get the mode of 45.3 if you are using the same data as in this example.
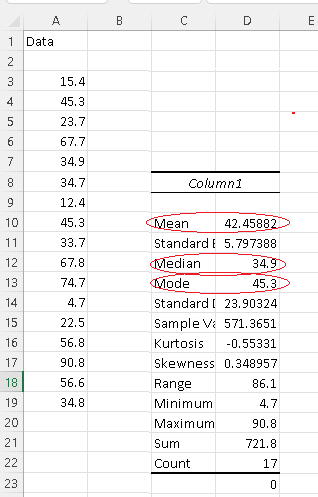
Method 2: Using Data Analysis in Excel ( see Load The Analysis ToolPack in Excel )
This way to calculate the measures of central tendency uses "Data Analaysis " in Excel. All the steps are described in
descriptive statistics using excel and below we show the reults of the same data used above in method 1 and as we can see the results for the mean, median and mode are the same.
Problems with Solutions
Problem 1
Find the measures of central tendency, the mean, median and mode, for each data set given below:
a) \( -6 , 0 , 3 , 4 , - 5 , 6 , 12 , - 7 \)
b) \( -6.2 , 0.5 , - 3.2 , 4.9 , - 3.7 , 6.9 , 2.6 , - 9.7 , 10.2 , 9.1 , -7.2 \)
Problem 2
For each data set given below, which is more appropriate to describe the data, the mean or the median? Justify the answer using a number line.
a) \( 6 , -4 , 3 , 4 , - 5 , 6 , 11 , - 7 \)
b) \( -6.2 , 0.5 , - 3.2 , 4.9 , - 3.7 , 6.9 , 2.6 , - 349.7 , 5.4\)
Solutions to the Above Problems
Solution to Problem 1
a)
mean: \( \bar x = \dfrac{-6 + 0 + 3 + 4 - 5 + 6 + 12 - 7}{8} = \dfrac{7}{8}\)
Order data: \( -7 , -6 , -5 , \color{red}{0 , 3} , 4 , 6 , 12 \)
The number of data values is even, hence median is equal to the average of the numbers in the center
median = \( \dfrac{0+3}{2} = \dfrac{3}{2} \)
b)
mean: \( \bar x = \dfrac{-6.2 + 0.5 - 3.2 + 4.9 - 3.7 + 6.9 + 2.6 - 9.7 + 10.2 + 9.1 -7.2 }{11} = 0.38 \)
Order data: \( -9.7 , -7.2 , -6.2 , -3.7 , -3.2 , \color{red} {0.5} , 2.6 , 4.9 , 6.9 , 9.1 , 10.2 \)
The number of data values is odd, hence the median is the number in the center
median = \( = 0.5 \)
Solution to Problem 2
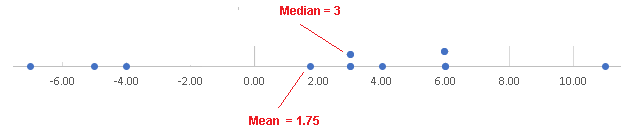
a)
mean: \( \bar x = \dfrac{6 -4 + 3 + 4 - 5 + 6 + 11 - 7}{8} = 1.75\)
Order data: \( -7 , -5 , -4 , \color{red} {3 , 4 } , 6 , 6 , 11 \)
The number of data values is even, hence the median is equal to the average of the numbers in the center
median = \( \dfrac{3+4}{2} = 3 \)
Both the mean and the median are located close within the range of data values and therefore either the median or the mean may be used to describe the given data set.
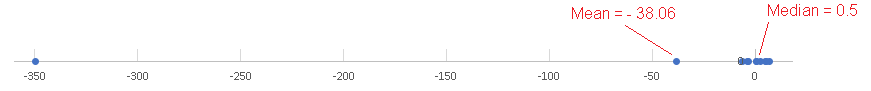
b)
mean: \( \bar x = \dfrac{-6.2 + 0.5 - 3.2 + 4.9 - 3.7 + 6.9 + 2.6 - 349.7 + 5.4 }{11} = -38.06 \)
Order data: \( -349.7 , -6.2 , -3.7 , -3.2 , \color{red}{ 0.5} , 2.6 , 4.9 , 5.4 , 6.9 \)
The number of data values is odd, hence the median is equal to the the number in the center
median = \( = 0.5 \)
The median is located close to most data values and therefore it may be used to describe the given data set.
More References and links
- Complete Business Statistics - Amir D. ACZEL and JAYAVEL SOUNDERPANDIAN - 6th International Edition - 2006 - ISBN 007 - 124416-6
- Solutions for Elementary Statistics a Step by Step Approach - Allan G. Bluman - 9th Edition - 2017 - ISBN-10 : 1259755339
- Complete Business Statistics - Amir D. ACZEL - 2009 - ISBN-10 : 0073373605
- Statistics - James McClave et Terry Sincich - 13th Edition - 2016 - ISBN-10 : 0134080211
Variance and Standard Deeviation