Correlation Coefficient Examples with Solutions
Table of Contents
The correlation coefficient, which is used to quantify and measure the relationship between two data sets, is presented with examples and their solutions.
The definition and interpretation of the correlations are first presented. Calculations of the correlation using the definition and the using sums are also presented through examples with detailed solutions.
Definition of the Correlation Coefficient
The correlation coefficient \( r \) between two variables \( x \) and \( y \) is a measure of the linear relationship between the two variables. \( r \) can take values within the closed interval \( [-1 , 1] \).
If \( r = 0 \), there is no correlation between the two variables and therefore no linear relationship between the two variables exists.
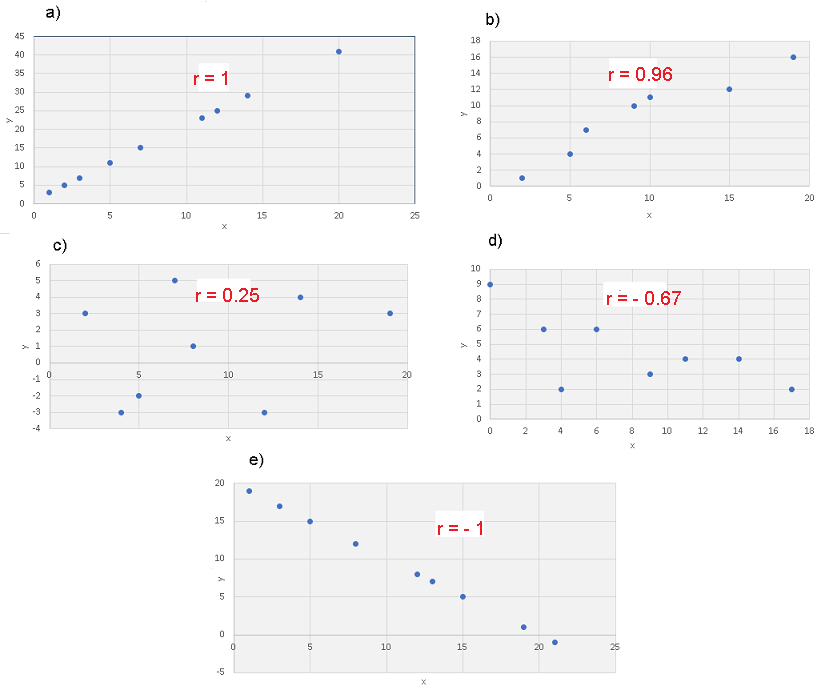
If \( r = 1 \), there is a perfect positive correlation between the two variables and the plot of pairs of the two varibales lie in a line with a positive slope; see figue a) below as an example
If \( r = - 1 \), there is a perfect negative correlation between the two variables and the plot of pairs of the two varibales lie in a line with a negative slope; see figue e) below as an example,.
Any value of \( r \) whose absolute value is close to \( 1 \), indicates that data is strongly correlated . As an example, see figue b) below.
Any value of \( r \) whose absolute value is not close to \( 1 \), indicates that data is weakly correlated . As an example, see figues c) and d) below.
The correlation \( r \) of a sample data set given by \( m \) pairs \( (x_i , y_i) \) is defined by [1,2]
\[ r = \dfrac{\sum_{i=1}^m(y_i-\bar y )(x_i-\bar x )}{\sqrt{\sum_{i=1}^m(x_i-\bar x)^2 \sum_{i=1}^m(y_i-\bar y)^2 }} \quad (I)\]
where \( \bar x \) is the mean of the \( x_i \) values and \( \bar y \) is the mean of the \( y_i \) values.
The numerator in the above formula is proportional to the covariance [1,2]. It is the sum of the products of the deviation of the variable \( x \) and the variable \( y \) from their respective means. It is a statistical measure used to analyze the linear relationship between two variables \( x \) and \( y \).
Interpretation of the Correlation Coefficient
We now give a geometrical interpretation to the above formula considering three cases.
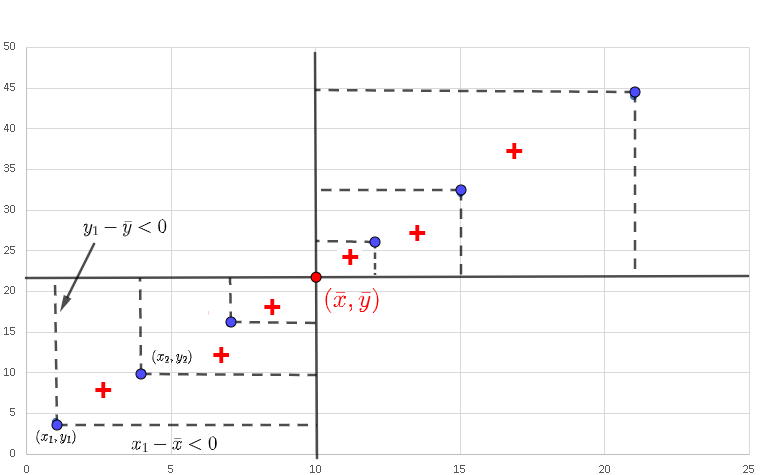
Case 1 - Points on a line with positive slope
We first note that the product \( (y_i-\bar y )(x_i-\bar x ) \) represent the area of a rectangle of length \( (x_i-\bar x ) \) and width \( (y_i-\bar y ) \) with either a positive or a negative sign.
In the graph below are shown pairs of points with coordinates \( (x_i,y_i) \) and the point \( (\bar x,\bar y) \). In this case, the points \( (x_i,y_i) \) are on a line with positive slope, the products \( (y_i-\bar y )(x_i-\bar x ) \) have positive (+) signs and therefore add up to a large positive value. Hence the numerator is a large positive quantity.
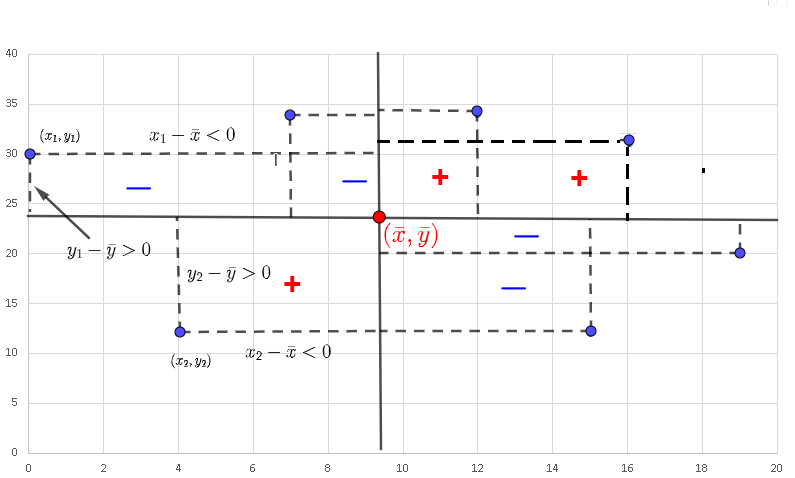
Case 2 - Points not on a line
In the graph below, the points \( (x_i,y_i) \) are not on a line, the products \( (y_i-\bar y )(x_i-\bar x ) \) have positive (+) and negative (-) signs and therefore cancel each other when added; hence the covariance has a value close to zero.
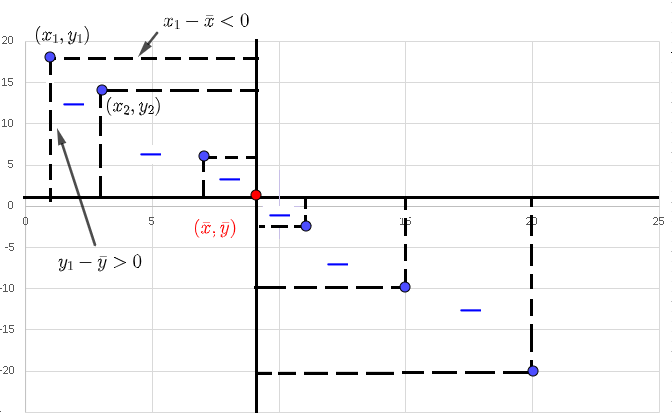
Case 3 - Points on a line with negative slope
In this case, the points \( (x_i,y_i) \) are on a line with a negative slope, the products \( (y_i-\bar y )(x_i-\bar x ) \) have negative (-) signs and therefore add up in absolute value, hence the covariance has a negative value with large absolute value.
The denominator in the formula of the correlation is a positive quantity used to standardize the measure of the linear relationship between two variables. Hence, the value of \( r \) is always in the interval \( [-1 , 1] \) and may therefore be used
to compare the linear relationship between any pairs of variables.
Calculation of the Correlation Coefficient From the Definition Formula (I)
One way to understand the formula defining the correlation is to use it to calculate the correlation of the data points shown in the graph below. This way of calculating the correlation needs the calculation of the means \( \bar x \) and \( \bar y \) and is therefore not recommended, it would however help us understand the meaning of the correlation.
Three examples corresponding to the three cases used above in the interpretation will be used to calculate the correlation coefficient using its definition.
Example 1 - Aligned Data Points with a Positive Slope
Given the data points
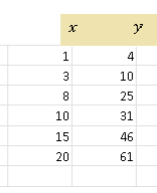
use Excel or Google Sheets to create a scatter plot and calculate the correlation coefficient using the definition.
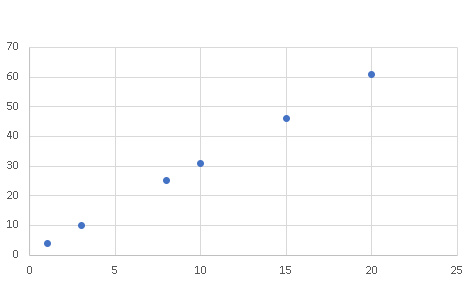
Solution to Example 1
Excel was used to create the scatter plot of the given data points.
A table of values of all the quantities included in the formula of the correlation coefficient \( r \) are shown. These calculations were done using Excel.
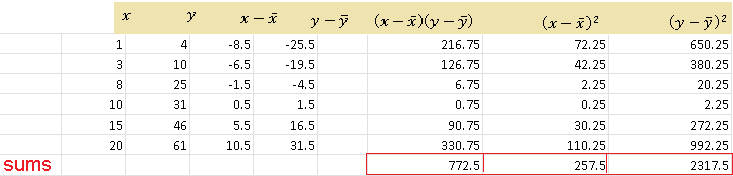
Use the formula,
\( r = \dfrac{\sum_{i=1}^m(y_i-\bar y )(x_i-\bar x )}{\sqrt{\sum_{i=1}^m(x_i-\bar x)^2 \sum_{i=1}^m(y_i-\bar y)^2 }} \\
\quad = \dfrac{772.5}{\sqrt{257.5 \times 2317.5}} \\
= 1
\)
Note that the scatter plot shows data points that are aligned. The covariance terms \( (y_i-\bar y )(x_i-\bar x ) \) are all positive (see table above) and they add up to given a relatively large value for the numerator \( \sum_{i=1}^m(y_i-\bar y )(x_i-\bar x ) \) in the formula of the correlation; hence the correlation is closer or equal to 1 as the calculations show.
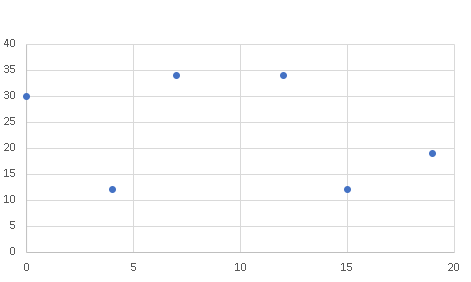
Example 2 - Non Aligned Data Points
Given the data points
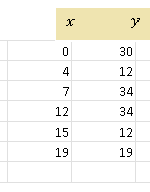
use Excel or Google Sheets to create a scatter plot and calculate the correlation coefficient using the definition.
Solution to Example 2
Excel was used to create the scatter plot shown below.
A table of values of all the quantities included in the formula of the correlation coefficient \( r \) are shown. These calculations were done using Excel.
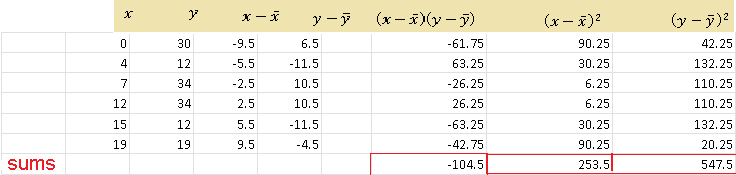
Use the formula,
\( r = \dfrac{\sum_{i=1}^m(y_i-\bar y )(x_i-\bar x )}{\sqrt{\sum_{i=1}^m(x_i-\bar x)^2 \sum_{i=1}^m(y_i-\bar y)^2 }} \\
\quad = \dfrac{-104.5}{\sqrt{253.5 \times 547.5}} \\
= -0.2805
\)
Note that the scatter plot shows data points that are not aligned. The covariance terms \( (y_i-\bar y )(x_i-\bar x ) \) have different signs (see table above) and when added, they cancel each other to give a relatively low value for the numerator \( \sum_{i=1}^m(y_i-\bar y )(x_i-\bar x ) \) in the formula of the correlation; hence the correlation is closer to zero.
Example 3 - Aligned Data Points with Negative Slope
Given the data points
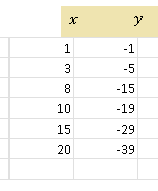
use Excel or Google Sheets to create a scatter plot and calculate the correlation coefficient using the definition.
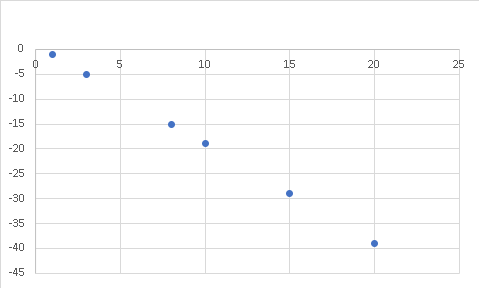
Solution to Example 3
Excel was used to create the scatter plot shown below.
A table of values of all the quantities included in the formula of the correlation coefficient \( r \) are shown. These calculations were done using Excel.
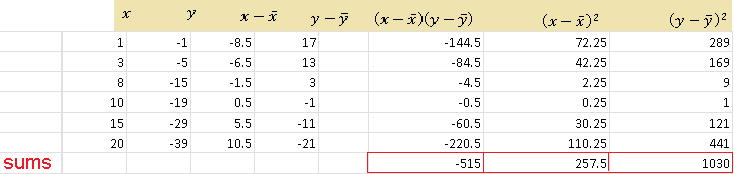
Use the formula,
\( r = \dfrac{\sum_{i=1}^m(y_i-\bar y )(x_i-\bar x )}{\sqrt{\sum_{i=1}^m(x_i-\bar x)^2 \sum_{i=1}^m(y_i-\bar y)^2 }} \\
\quad = \dfrac{-515}{\sqrt{257.5 \times 1030}} \\
= - 1
\)
Note that the scatter plot shows data points that are aligned. The covariance terms \( (y_i-\bar y )(x_i-\bar x ) \) are all negative (see table above) and the numerator \( \sum_{i=1}^m(y_i-\bar y )(x_i-\bar x ) \) in the formula of the correlation is negative and its absolute value is relatively large; hence the correlation is closer or equal to -1 as shown in the calculations.
Calculation of the Correlation Coefficient Using Sums Formulas (II) and (III)
Let us define the following sums of squares used in the definition of the correlation coefficient:
\( SS_x = \sum_{i=1}^m (x_i - \bar x)^2 \)
,
\( SS_y = \sum_{i=1}^m (y_i - \bar y)^2 \)
and the sum of cross product also used in the definition of the correlation coefficient:
\( SS_{xy} = \sum_{i=1}^m (x_i - \bar x) (y_i - \bar y) \)
We now expand \( SS_x \) as follows
\( SS_x = \sum_{i=1}^m (x_i - \bar x)^2 = \sum_{i=1}^m (x_i^2 + \bar x^2 - 2 x_i \bar x) \\
= \sum_{i=1}^m x_i^2 + m \bar x^2 - 2 \bar x \sum_{i=1}^m x_i \\
= \sum_{i=1}^m x_i^2 + m \bar x^2 - 2 n \bar x^2 \\
= \sum_{i=1}^m x_i^2 - m \bar x^2 \\
= \sum_{i=1}^m x_i^2 - \dfrac{(\sum_{i=1}^m x_i)^2}{m} \)
Similarly, it can also be proved that
\( SS_y = \sum_{i=1}^m y_i^2 - \dfrac{(\sum_{i=1}^m y_i)^2}{m}
\)
\( SS_{xy} = \sum_{i=1}^m x_i y_i - \dfrac{\sum_{i=1}^m x_i \sum_{i=1}^m y_i}{m} \)
A formula to calculate \( r \) may be written as
\[ r = \dfrac{SSxy}{\sqrt {SSx \cdot SSy}} \quad (II) \]
or
\[ r = \dfrac{ \sum_{i=1}^m x_i y_i - \dfrac{\sum_{i=1}^m x_i \sum_{i=1}^m y_i}{m} }{\sqrt { \left(\sum_{i=1}^m x_i^2 - \dfrac{(\sum_{i=1}^m x_i)^2}{m} \right) \left(\sum_{i=1}^m y_i^2 - \dfrac{(\sum_{i=1}^m y_i)^2}{m} \right) }} \quad (III) \]
We can see that there is no need to calculate the means \( \bar x \) and \( \bar y \) in order to calculate the correlation coefficient \(r \). The above formula involving the sums will be used to calculate the correlation coefficient \( r \).
Although there are many software applications that may be used to calculate the correlation coefficient, it is always a good idea to do some examples by hand first in order to gain deep understanding of the concept of the correlation coefficient.
Example 4
Given the table of data pairs \( (x_i , y_i) \), use a table to find the correlation coefficient between the two data sets using the formula above.

Solution Example 4
We first generate a table of values of all sums involved in the formula. I have used Excel to arrange my data and do the sums. You may also use other applications software such as Google Sheets.
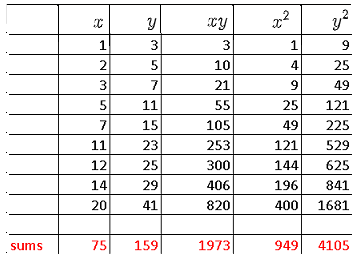
From the table, we have
\( \sum_{i=1}^m x_i = 75 \)
\( \sum_{i=1}^m y_i = 159 \)
\( \sum_{i=1}^m x_i y_i = 1973 \)
\( \sum_{i=1}^m x_i^2 =949 \)
\( \sum_{i=1}^m y_i^2 = 4105 \)
Substitute in the formula
\[ r = \dfrac{ 1973 - \dfrac{75 \cdot 159}{9} }{\sqrt { \left(949 - \dfrac{(75)^2}{9} \right) \left(4105 - \dfrac{(159)^2}{9} \right) }} = 1\]
Note the the correlation coefficient may be calculated using Excel software application especially when the data sets are large as in the case of real life studies of the correlation coefficient
.
More References and links
- Complete Business Statistics - Amir D. ACZEL and JAYAVEL SOUNDERPANDIAN - 6th International Edition - 2006 - ISBN 007 - 124416-6
- Solutions for Elementary Statistics a Step by Step Approach - Allan G. Bluman - 9th Edition - 2017 - ISBN-10 : 1259755339
- Probability, Statistics and Estimations
- Statistics - James McClave et Terry Sincich - 13th Edition - 2016 - ISBN-10 : 0134080211
- Complete Business Statistics - Amir D. ACZEL - 2009 - ISBN-10 : 0073373605
- Correlation Problems with Real Life Data
- Calculate Correlation Using Excel