Introduction to Statistics
Table of Contents
The concepts of data and statistics are presented along with examples. The
types of data , discrete and continuous variables are also introduced. Population and samples are also defined.
Descriptive and inferential statistics are briefly introduced.
Data
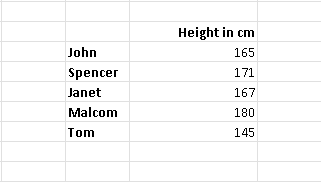
A data set is a set of measurements or observations on a given variable. For example the height of a goup of people, as shown below, is data.
In the example below, the height is the variable and the set of values {165,171,167,180,145} is the data set.
Data may also be collected through observations: color of cars for example.
Data may be collected through measurements: measure the height of trees.
Data may be collected by counting: count the number of students in each classroom of a school.
Data may be collected as answers to questions in surveys: ask a group of people about their preferences for a given product.
Each value in a data set is called data value.
Data collected may be used to make important decisions. But before being used, data must first be analyzed. The latest technological developments made it possible to collect large amount of raw data and therefore efficient
methods and tools are needed to analyze and hence make sense of this data and therefore make decisions.
Data analysis presents data in useful and meaningful way that may be used to make important decisions.
Variables and Types of Data
Quantitative and Qualitative
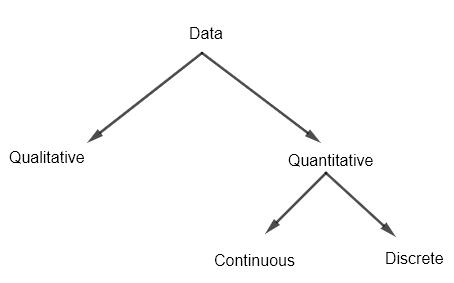
A variable may be quantitative or qualitative.
Quantitative variables representing quantities such as price, height, number of students, ... are represented by numbers.
Qualitative variables corresponding to data such as colors, direction (North, South, ...), answers to questions (yes, no) are represented by words.
Continuous and Discrete Variables
A Variable corresponding to quantitative data may be classified as:
1 - A continuous variable can have an infinite number of values between any two values. continuous variables are usually represented by numbers including decimal points and are usually obtained by measurement.
Examples of continuous variables are:
a - height (cm): 1.23 , 0.49, 12.67,...
b - weight (Kg): 34.51 , 89.23 , 0.99, ...
c - time (seconds): 23.45 , 89.45 , 0.05 , ...
d - temperature (in degree Celsius): 12.56 , 78.91 , 90.34 , ...
2 - A discrete variable assumes values that can be counted.
a - number of students: 12 , 67 , 18 , ...
Populations and Samples
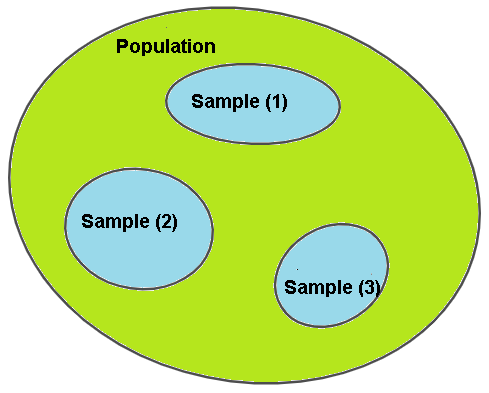
The population is the set of all measurements (or observations) being studied. A sample is a subset of measurements (or observations) from the population being studied.
Samples are usually selected in such a way that have the same or similar characteristics as the population.
Descriptive and Inferential Statistics
Statistics is the science of collecting, organizing, presenting and generalizing data. There are two major branches of statistics.
1 - Descriptive statistics includes the collection, such as measurements and observations of data, organization, creating summaries and presenting in the form of tables, graphs, patterns ... of data.
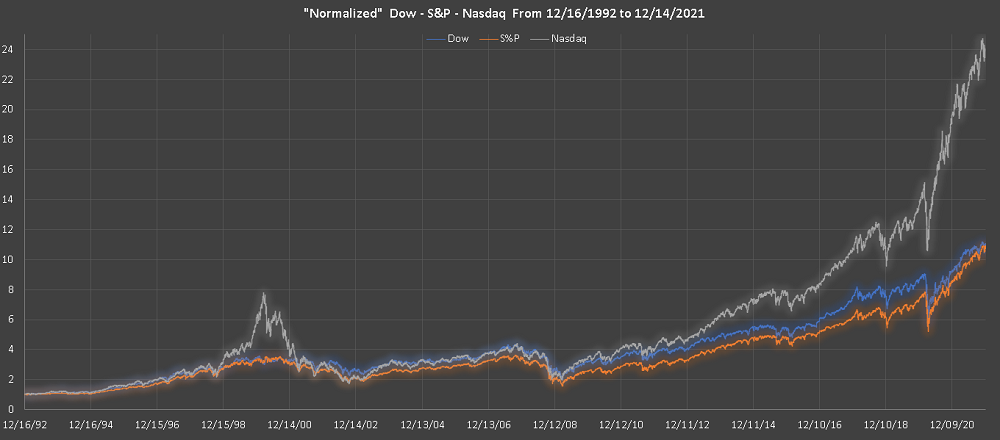
The amount of data may be overwhelming. As an example the data related to the values of the Dow, S&P and Nasdaq stock markets indices from 12/16/92 to 12/14/21 and consisting of 7303 rows are included in the table of Dow, S&P and Nasdaq. One cannot draw any conclusion by looking at the data in the table. However a simple graph as the one shown below, helps in drawing important conclusions: over the same period of time, the Nasdaq increased much faster than both the Dow and S&P indices.
Note that the data graphed below has been normalized such that the data values on the 12/16/92 is equal to 1. This is done by dividing all data values by the data value on the date 12/16/92.
2 - Inferential statistics includes the conclusion and generalizations of data behavior of a population using samples of the population. To ensure an accurate statistical inference, data sample must represent every segment of the population.
In surveys for example, people should be randomly selected in order to draw accurate inferences that make sense.
More References and links
- Complete Business Statistics - Amir D. ACZEL and JAYAVEL SOUNDERPANDIAN - 6th International Edition - 2006 - ISBN 007 - 124416-6
- Solutions for Elementary Statistics a Step by Step Approach - Allan G. Bluman - 9th Edition - 2017 - ISBN-10 : 1259755339
- Complete Business Statistics - Amir D. ACZEL - 2009 - ISBN-10 : 0073373605
- Statistics - James McClave et Terry Sincich - 13th Edition - 2016 - ISBN-10 : 0134080211