Steps to compute the the coefficients involved in the simple linear regression.
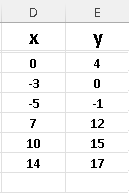
Step 1 - Organize the data sets in columns and use labels in the first row such X and Y below to make it easier to interpret the results.
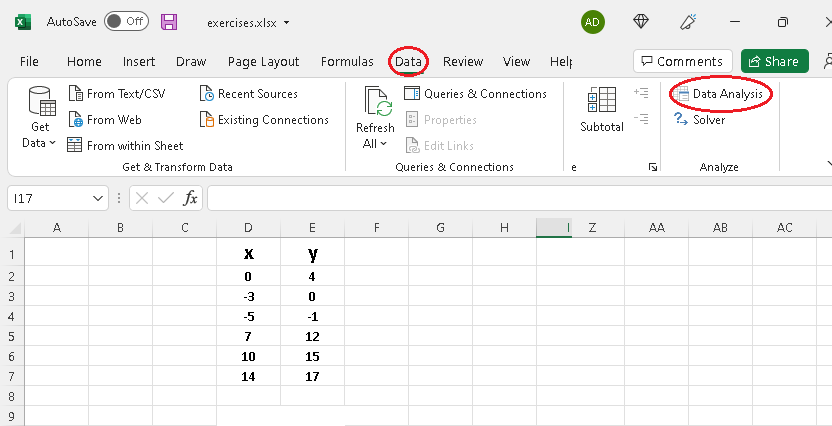
Step 2 - Press "Data" tab and click on "Data Analysis".
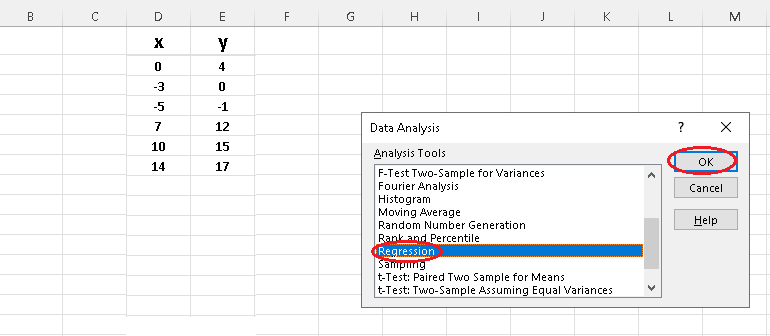
Step 3 - Select "regression" and press "OK".
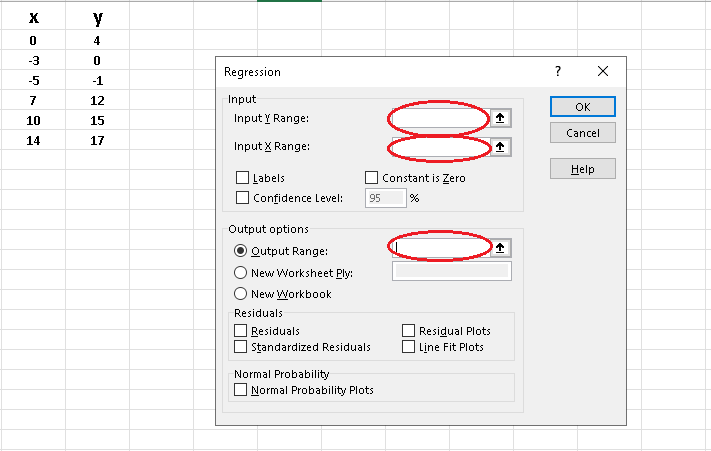
Step 4 - Clear "Input Y Range" , "Input X Range" and "Output Range".
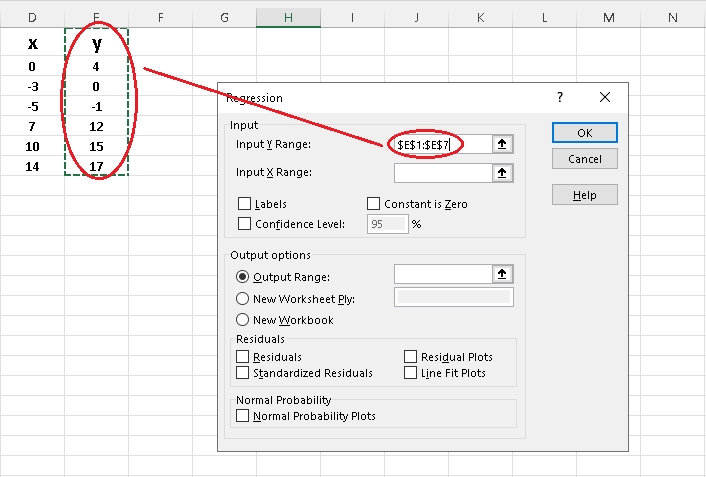
Step 5 - Click in "Input Y Range" and use the mousse to select the column containing the Y values including the label.
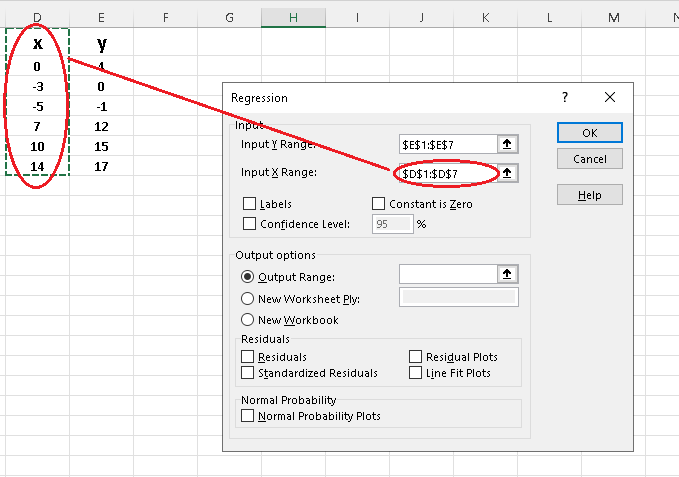
Step 6 - Click in "Input X Range" and use mousse to select the column containing the X values including the label.
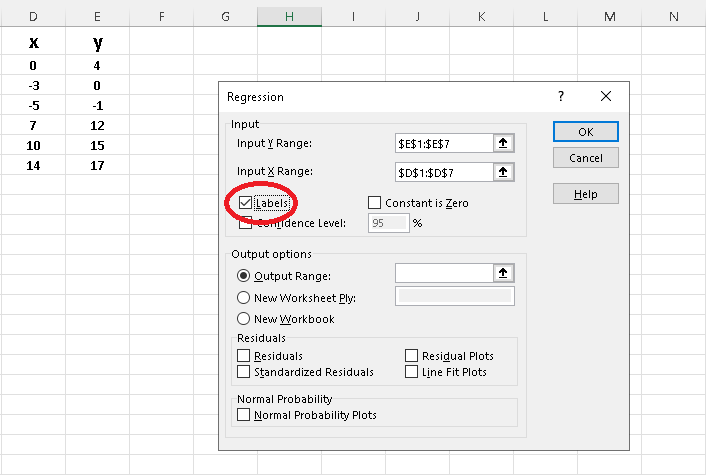
Step 7 - Check "Labels".
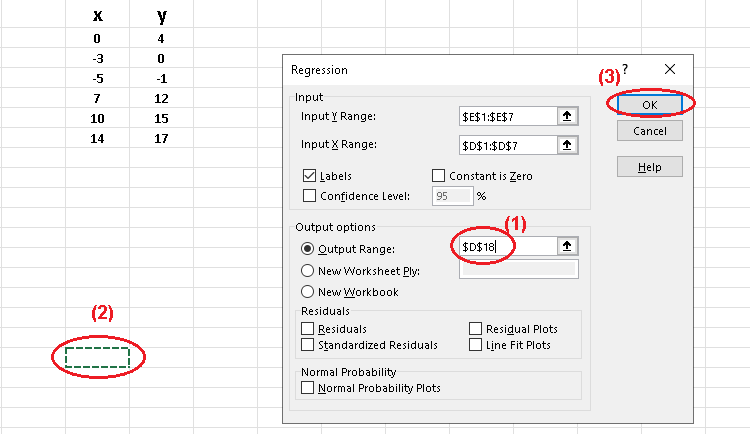
Step 8 - Check "Output Range" radio button, click inside the small window (1) , click a cell where the results will be displayed (2) and click "OK" (3).
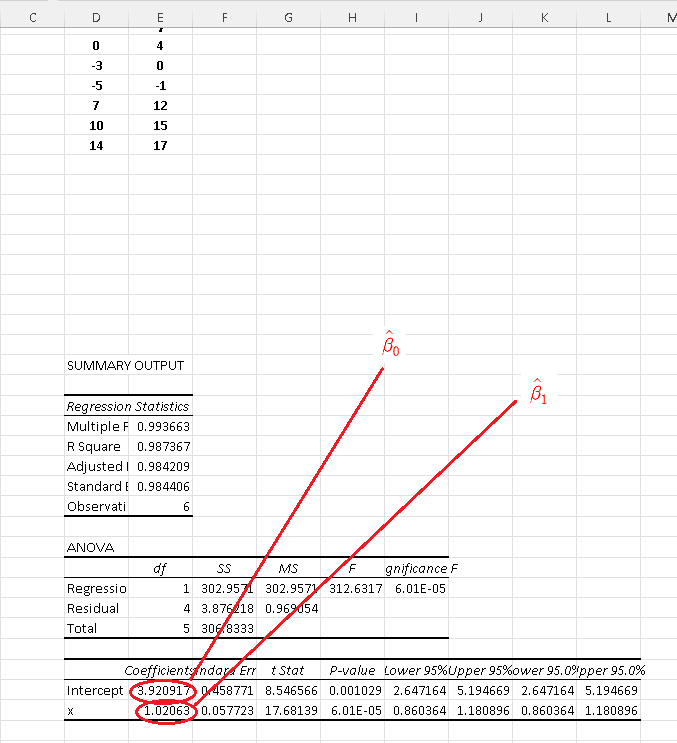
Step 9 - Read results from table.
The results are displayed in a table with many parameters where \( \hat \beta_0 \) is the intercept and equal to \( 3.92091 \) in this example and \( \hat \beta_1 \) is the coefficient of \( x \) and equal to \( 1.02063 \) in this example.
The simple linear regression model is give by: \[ \hat y = \hat \beta_1 x + \hat \beta_0 \]